Photos | Analyzing Data on Screen
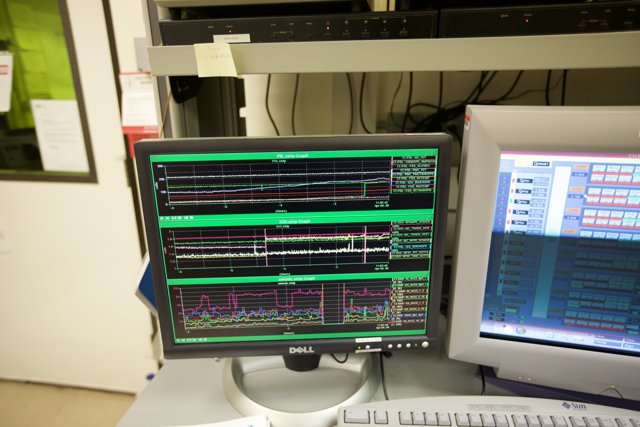
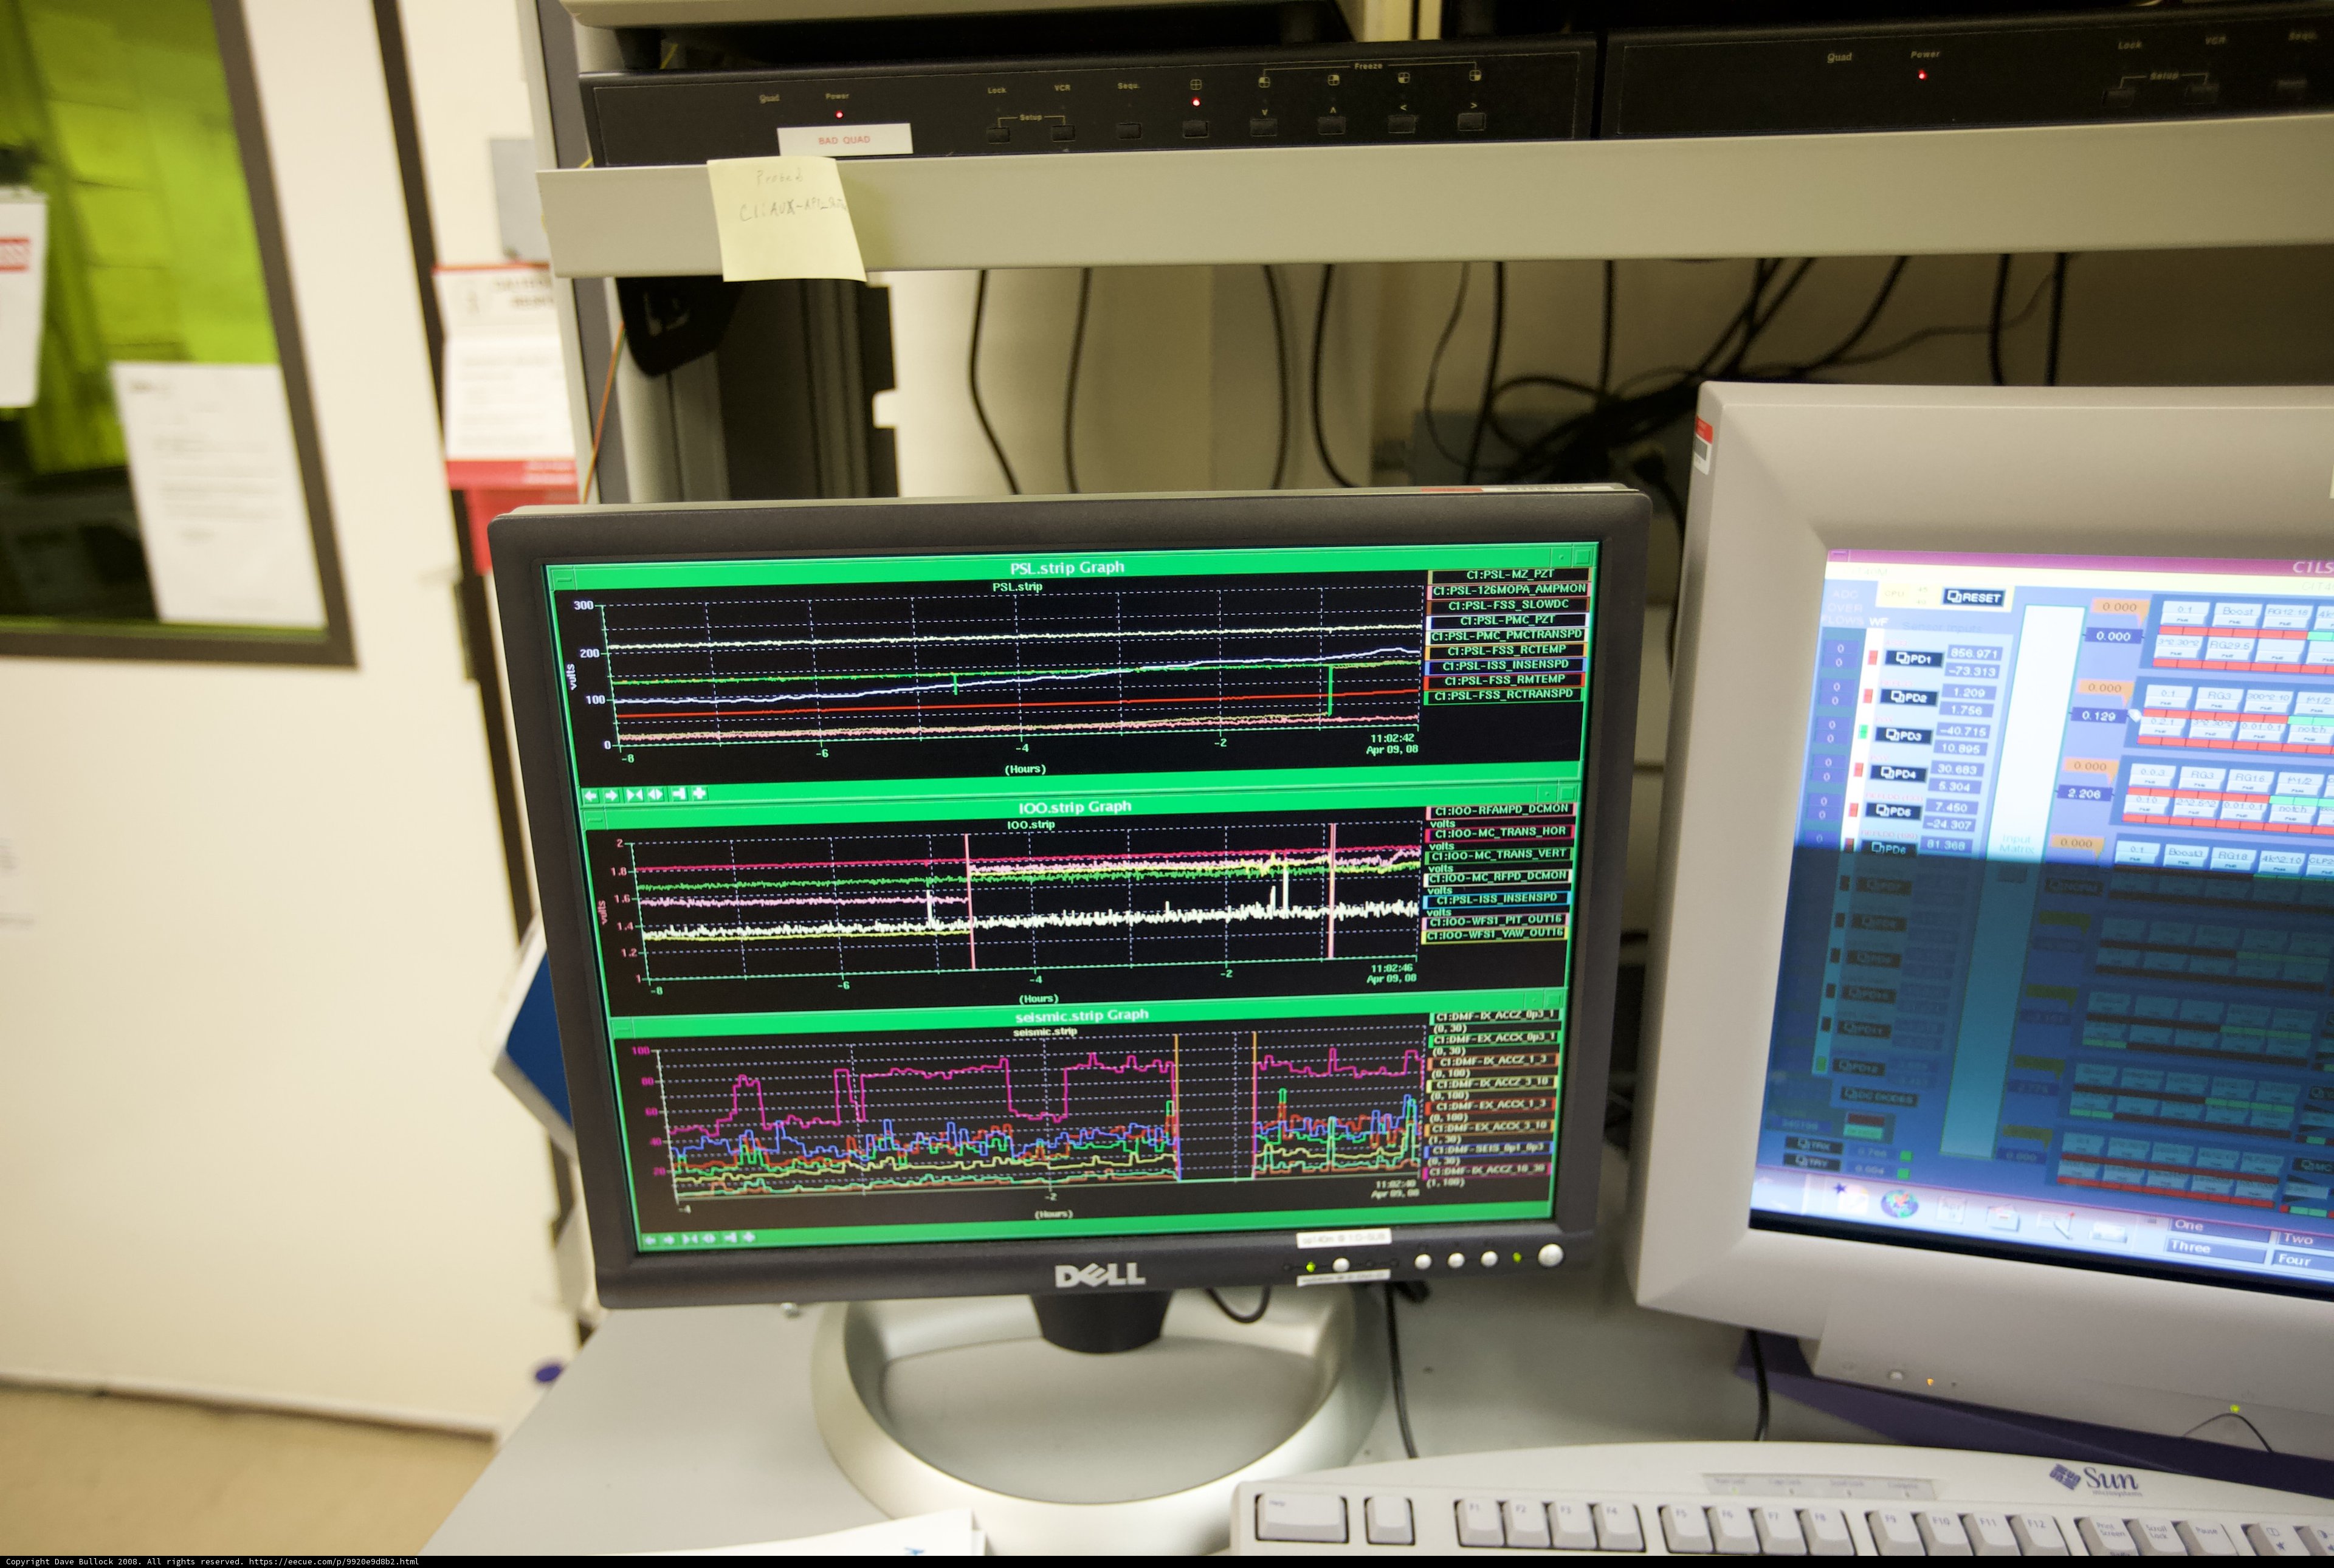
A computer monitor displays a graph, as part of the data analysis process at Caltech LIGO research center in 2008.
BLIP-2 Description:
a computer monitor with a graph on itChronologically Adjacent
Note: You can also navigate with your arrow keys or swiping.
Metadata
Capture date:
Original Dimensions:
4368w x 2912h - (download 4k)
Usage
Dominant Color:
iso
1600
metering mode
5
aperture
f/2.8
focal length
24mm
shutter speed
1/200s
camera make
Canon
camera model
lens model
overall
(52.15%)
curation
(50.00%)
highlight visibility
(2.44%)
behavioral
(70.22%)
failure
(-0.17%)
harmonious color
(8.78%)
immersiveness
(0.88%)
interaction
(1.00%)
interesting subject
(-34.11%)
intrusive object presence
(-4.64%)
lively color
(16.14%)
low light
(17.02%)
noise
(-0.44%)
pleasant camera tilt
(-10.03%)
pleasant composition
(-20.94%)
pleasant lighting
(-0.64%)
pleasant pattern
(11.13%)
pleasant perspective
(27.49%)
pleasant post processing
(14.92%)
pleasant reflection
(-1.35%)
pleasant symmetry
(5.10%)
sharply focused subject
(2.34%)
tastefully blurred
(10.33%)
well chosen subject
(-4.42%)
well framed subject
(28.34%)
well timed shot
(0.13%)
all
(8.30%)
* WARNING: The title and caption of this image were generated by an AI LLM (gpt-3.5-turbo-0301
from
OpenAI)
based on a
BLIP-2 image-to-text labeling, tags,
location,
people
and album metadata from the image and are
potentially inaccurate, often hilariously so. If you'd like me to adjust anything,
just reach out.